Tutorial: Read and View a Mesh
This example loads a deforming heart model and allows you to vary time with a slider to animate its deformation. You can rotate, pan and zoom the model in the window using the same controls as the Cmgui application (which uses Zinc under the hood!).
It uses the Zinc Widget which takes care of graphics rendering so you only need to take care of the parts that are special to your application.
Topics which this example show include:
- Setting up the Zinc Context
- Configuring the Zinc Widget
- Reading a time-varying model from EX files using a stream information object
- Making surface and points graphics.
The souce code used in this tutorial is available from the physiome project svn server.
Overview
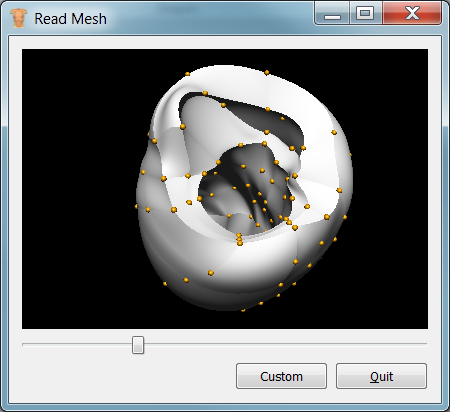
This example comes with a Qt user interface layout already defined in the read_mesh.ui file. It consists of a Zinc Widget which handles the graphics, a slider control and two buttons ‘Quit’ and ‘Custom’. When you run the example with ‘python read_mesh.py’ you can slide the time slider to vary time and animate the model, which is initially drawn with surface graphics. Clicking on the Custom button adds gold points at the nodes.
Initialising your application
The Read Mesh dialog is derived from QWidget. Following is its initialisation method:
1 2 3 4 5 6 7 8 9 10 11 12 13 14 15 16 17 18 19 20 21 22 23 24 25 26 27 28 29 30 31 32 33 34 35 36 37 38 39 40 | def __init__(self, parent=None):
'''
Initiaise the ReadMeshDlg first calling the QWidget __init__ function.
'''
QtGui.QWidget.__init__(self, parent)
# create instance of Zinc Context from which all other objects are obtained
self._context = ZincContext("ModelViewer");
# set up standard materials and glyphs so we can use them elsewhere
self._materialmodule = self._context.getMaterialmodule()
self._materialmodule.defineStandardMaterials()
self._glyphmodule = self._context.getGlyphmodule()
self._glyphmodule.defineStandardGlyphs()
# improve tessellation quality
tessellationmodule = self._context.getTessellationmodule()
defaultTessellation = tessellationmodule.getDefaultTessellation()
defaultTessellation.setMinimumDivisions([6])
default_region = self._context.getDefaultRegion()
timekeepermodule = self._context.getTimekeepermodule()
self._timekeeper = timekeepermodule.getDefaultTimekeeper()
# create region to load mesh into
self._region = default_region.createChild('myregion')
# read the model and create some graphics to see it
self.readMesh()
self.createSurfaceGraphics()
# Using composition to include the visual element of the GUI.
self.ui = Ui_ReadMeshDlg()
self.ui.setupUi(self)
# Must pass the context to the ZincWidget for it to work
self.ui._zincwidget.setContext(self._context)
self.setWindowIcon(QtGui.QIcon(":/cmiss_icon.ico"))
# set up callbacks for changes in the time slider
self.ui.timeSlider.valueChanged.connect(self.timeChanged)
self.resize(620, 440)
|
Most of what is being done here is explained in the comments. Some parts are initialising member variables for convenient use later; by convention, these begin with an underscore. This example is somewhat contrived as it reads exactly one mesh and sets up graphics appropriate to it; in a real application one may have a file dialog to choose input files.
Reading a time-varying model
1 2 3 4 5 6 7 8 | def readMesh(self):
sir = self._region.createStreaminformationRegion()
for i in range(51):
filename = 'mesh_data/heart{:0>4}.exnode'.format(i)
fr = sir.createStreamresourceFile(filename)
sir.setResourceAttributeReal(fr, StreaminformationRegion.ATTRIBUTE_TIME, i/50.0)
sir.createStreamresourceFile('mesh_data/heart.exelem')
self._region.read(sir)
|
This example uses a stream information to read 51 node files from a time-varying solution, and associates time with each file. The single element file is added to the information and these are read together into the region.
Creating surface graphics
1 2 3 4 5 6 7 8 9 10 11 12 13 14 15 | def createSurfaceGraphics(self):
scene = self._region.getScene()
field_module = self._region.getFieldmodule()
# We use the beginChange and endChange to wrap any immediate changes and will
# streamline the rendering of the scene.
scene.beginChange()
surface = scene.createGraphicsSurfaces()
coordinate_field = field_module.findFieldByName('coordinates')
surface.setCoordinateField(coordinate_field)
surface.setExterior(True) # show only exterior surfaces
# Let the scene render the scene.
scene.endChange()
|
With one minor exception (Points on the simple ‘point’ domain), every graphics object needs a coordinate field to give its coordinates, and here we find this by name ‘coordinates’ in the fieldmodule which manages fields in our region.
Updating time
1 2 | def timeChanged(self, value):
self._timekeeper.setTime(value/100.0)
|
The timeChanged() method was set up in the initialise function. It takes the time from the slider widget and sets it in Zinc’s default timekeeper object, so zinc knows which time to generate graphics at. Note that the Zinc Widget is automatically informed that the graphics have been changed, and redraws itself.
The Custom button
1 2 3 4 5 | def customButton(self):
'''
Open model and visualise lines.
'''
self.createPointGraphics()
|
This method is called when the Custom button is clicked, and is currently set to add points graphics.
Creating node points graphics
1 2 3 4 5 6 7 8 9 10 11 12 13 14 15 16 17 18 19 20 21 22 23 | def createPointGraphics(self):
scene = self._region.getScene()
graphicsName = "points"
# only create points if we don't already have them
existingGraphics = scene.findGraphicsByName(graphicsName)
if existingGraphics.isValid():
return
field_module = self._region.getFieldmodule()
scene.beginChange()
# create points at nodes shown with gold spheres
points = scene.createGraphicsPoints()
points.setName(graphicsName)
coordinate_field = field_module.findFieldByName('coordinates')
points.setFieldDomainType(Field.DOMAIN_TYPE_NODES) # show points at nodes
points.setCoordinateField(coordinate_field)
pointattr = points.getGraphicspointattributes()
pointattr.setGlyphShapeType(Glyph.SHAPE_TYPE_SPHERE)
pointattr.setBaseSize([2.0])
gold = self._materialmodule.findMaterialByName("gold")
points.setMaterial(gold)
scene.endChange()
|
Points have a lot more options than surfaces, since you need to decide which domain to view points on, the glyph (here: a sphere) to visualise each point, scaling of the glyph, and more. Point-specific attributes of the glyph are set by the Graphicspointattributes object, and include methods for setting many other scaling options, adding labels and setting the font.
Extending this example
As an exercise you may wish to make your own visualisation or other change, perhaps adapting the customButton() method to do something different. If you have access to QtDesigner you may wish to add more buttons and controls, add signals (actions) and slots (methods on your object) to make them perform useful tasks.