Build OpenCMISS and Your Problem
To use TAU, OpenCMISS and your problem needs to be compiled with an extra stub variable, TAUPROF, set to true.
Because PAPI currently only compiles under the GNU compiler, you will need to explicitly add COMPILER=gnu to your make command to build OpenCMISS and your problem. This will profile your code using the TAU API calls made throughout OpenCMISS and you will usually not need to make any changes to your code.
TAU Environmental Variables
However, there are a few environmental variables you may like to set before running your TAU implemented code.
TAU_CALLPATH- Setting this to 1 will allow you to click through a hierarchical phase profile like the one which will be generated by your OpenCMISS example. This option is recommended.orexport TAU_CALLPATH=1setenv TAU_CALLPATH 1TAU_METRICS- Once you have used papi_avail to find out which PAPI counters are available, set this with the names of the PAPI counters you would like to capture (i.ePAPI_FP_OPSfor floating point operations) separated by “\:”. The default metric is TIME, which just measures the time during a measurement interval. PAPI throws an error if you try measure more than 3 metrics at a time.orexport TAU_METRICS=TIME\:PAPI_FP_OPSsetenv TAU_METRICS TIME\:PAPI_FP_OPSPROFILEDIR- Set this to the directory where you would like your profile files will written to. Otherwise, files will be saved to the working directoryorexport PROFILEDIR=<path to directory to write profiles to>setenv PROFILEDIR <path to directory to write profiles to>TAU_VERBOSE- Setting this to 1 to see the steps the TAU measurement systems takes when your application is running.orexport TAU_VERBOSE=1setenv TAU_VERBOSE 1
Run Your Problem
You can now run your problem as you would usually. Once your problem is finished, TAU will create files with filenames of the form, “profile.x.0.0” , where x corresponds to the number of the computational node the data is associated with. If you ran your problem with several TAU metrics, the profile data files will be contained in folders with names relating to the metric.
Visualisation
To visualise this data, you simply run paraprof in the directory containing the “profile.x.0.0” files or the directory containing the directories corresponding to metrics.
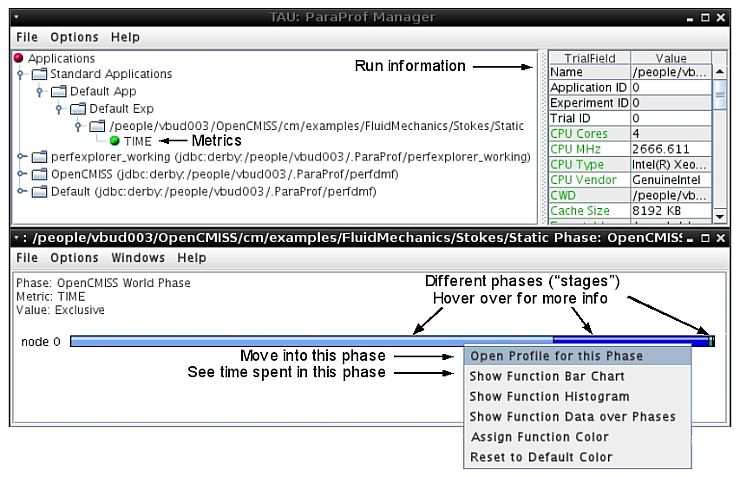
The image below shows you the basic elements of paraprof for a single computational node problem.
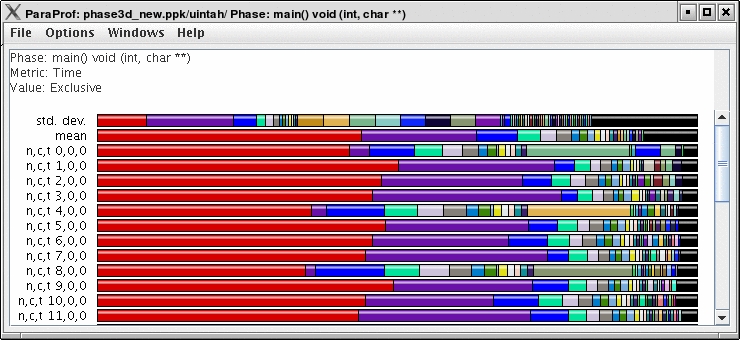
With more computational nodes, more bars will appear in the lower window as pictured below.
This image is courtesy of the University of Oregon, Performance Research Lab. For more information and help on ParaProf, visit this page in the TAU documentation. http://www.cs.uoregon.edu/research/tau/docs/newguide/bk03pt02.html